

What are moving averages? Trading guide for moving averages which include EMA, SMA, LWMA, HMA, TMA, SMMA, AMA, DEMA, TMA and more on price forms including OHLC. We will cover all the different types of moving averages along with their usefulness, shifts, and averaging periods. This guide answers the common question many traders ask themselves; which MA should I use?
Table of Contents
Types of Moving Averages
- SMA – Simple Moving Average
- EMA – Exponential Moving Average
- SMMA – Smoothed Moving Average
- LWMA – Linear Weighted Moving Average
- HMA – Hull Moving Average
- AMA – Adaptive Moving Average
- DEMA – Double Exponential Moving Average
- TEMA – Triple Exponential Moving Average
- TMA – Triangular Moving Average
Price forms used in Moving Averages
- Close Price (Included in OHLC)
- Open Price (Included in OHLC)
- High Price (Included in OHLC)
- Low Price (Included in OHLC)
- Median Price
- Typical Price
- Weighted Price
Moving Average Walkthrough
- What are Moving Averages (per choice)
- Why are Moving Averages useful vs other choices? (per choice)
- Usefulness of Moving Average shifts (horizontal) (global)
- How to choose averaging periods to use (global)
- This will be based upon strategy
When writing the explanations, there is limited scope for explanation for some points. The emphasis should be more on why it actually holds relevance. E.g. the definition of median prices is very simple, but why it holds value will be missed amongst most traders.
What are Moving Averages? What is a Moving Average?
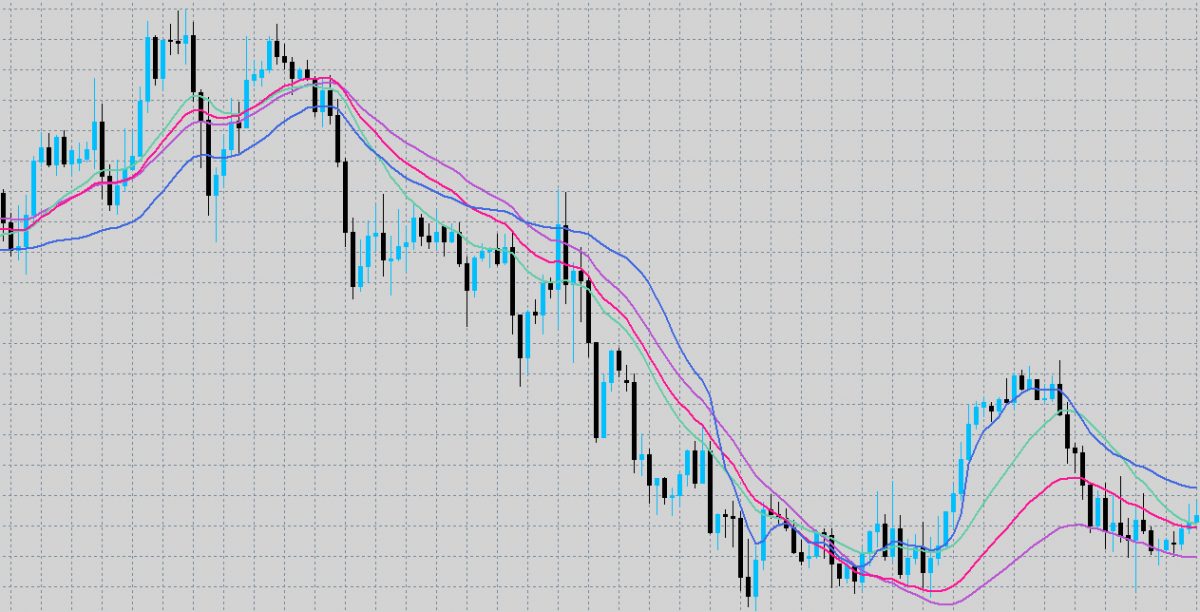
A moving average is a technical indicator that sums up the data points of a financial security over a specific time period and divides the total by the number of data points, hence the average. It is called a “moving” average because as new price data becomes available, the total average is recalculated – differing from a static average which is calculated only once. It is known as a ‘lagging indicator’ because it uses only historical values of the underlying assets, no projections are made in the calculations, to show the trend.
Different Types of Moving Averages
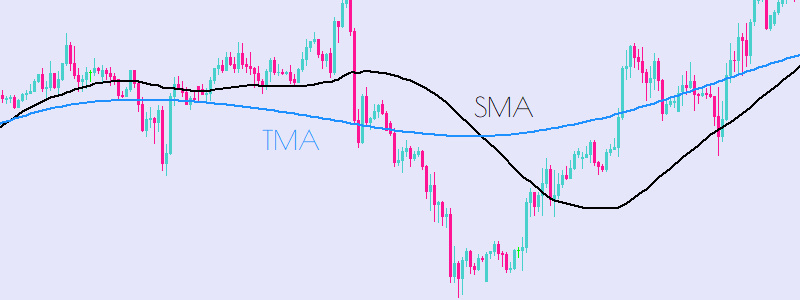
What is the Simple Moving Average (SMA)
The simple moving average (SMA) calculates an average of the last n prices, where n represents the number of periods for which you want the average.
The advantage of an SMA is in its name, it is simple. The SMA value equals the average price for the number of periods in the SMA calculation. Whilst some other MA’s such as the EMA may immediately start turning during a retracement – signalling a change in direction way too early, the SMA will not. This leads the SMA getting you into trades later, when there is a higher probability of success however this will of course vary by strategy. There is no added complexity to generate false signals through a flaw in its underlying process.
However, this is also a double-edged sword for the SMA is also very slow. The SMA moves much slower than other MA’s and it can keep you in trades longer when there are short-lived price movements and erratic behaviour.
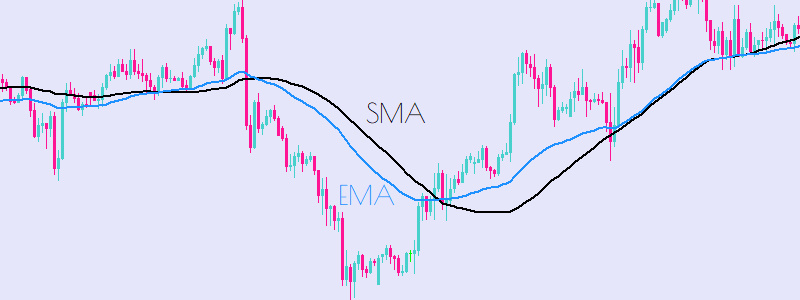
What is the Exponential Moving Average (EMA)
The exponential moving average (EMA) is a weighted average of the last n prices, where the weighting decreases exponentially with each previous price/period.
The largest difference between the EMA and the SMA is the responsiveness of the direction of the MA to a change in price, in other words its sensitivity. An exponential moving average tends to be more responsive to recent price changes as compared to the simple moving average which applies equal weight to all price changes in the given period.
For traders who are quite aggressive and hold positions for relatively short amounts of time, the EMA is preferable as it gives ample opportunity for traders to enter positions, however this does come with a larger proportion of false signals – reinforcing the requirement for excellent risk management skills to mitigate this downside.
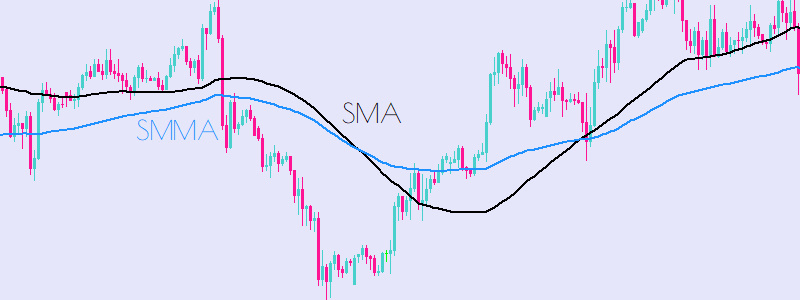
What is the Smoothed Moving Average (SMMA)
A Smoothed Moving Average is an Exponential Moving Average, only with a longer period applied. The calculation does not refer to a fixed period, but rather takes all available data series into account. The Smoothed Moving Average uses a longer period to determine the average, assigning a weight to the price data as the average is calculated. Thus, the oldest price data in the Smoothed Moving Average are never removed (like they are within a SMA), but they have only a minimal impact on the Moving Average. This long-weighted approach allows the moving average to smooth, hence the name, the price action. This thus makes the underlying trend in the data more apparent.
As all the other technical analysis indicators, the SMMA indicator works well only in certain market conditions. It works well on stable descending or ascending trends. Whereas in case of sideway market price movements, the SMMA indicator is useless. A trader should refrain from any trading activity within these consolidating markets.
The SMMA is desirable when trading longer horizons and explosive breakouts that often follow for example, a Bollinger band squeeze. The SMMA works well only when conjoined with other shorter-term indicators that allow the trader to time the entry into market.
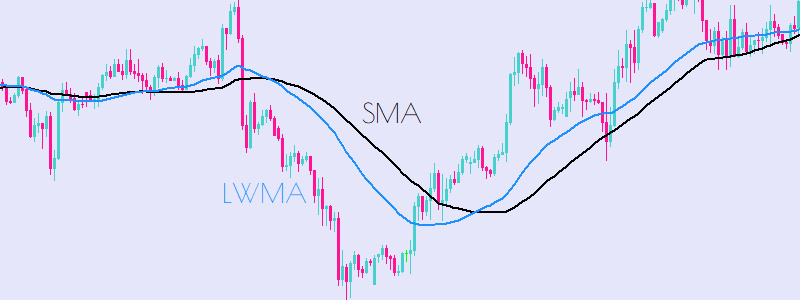
What is the Linear Weighted Moving Average (LWMA)
A linearly weighted moving average (LWMA) is a moving average calculation that more heavily weights recent price data. The most recent price has the highest weighting, and each prior price has progressively lower weighting’s. The weights drop in a linear fashion, hence the linear weighting nature of the moving average.
LWMAs are quicker to react to price changes than simple moving averages (SMA) and exponential moving averages (EMA). Making them more suitable for scalping strategies, however they do suffer a lagging effect and so traders should be cautioned to not only use the MA on its own.
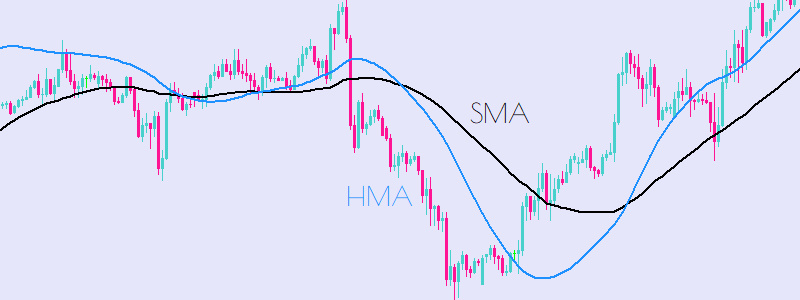
What is the Hull Moving Average (HMA)
Developed by Alan Hull in 2005, the Hull moving average aims to be responsive to current price activity whilst also remaining smooth. The Hull moving average aims to eliminate all lag between price movement and MA direction change.
The Hull Moving Average consists of taking the weighted moving average of the price period and performing mathematical calculations upon it. This all in all provided excellent price smoothness and responsiveness
Hull himself does not use the Hull MA in crossover strategies, instead it is preferred to use it as a directional indicator. For example say at a known support level the Hull MA turns upwards, that is seen as a bullish signal and vice versa.
The Hull MA is especially powerful when conjoined with a oscillator in a reversionary strategy such as the RSI which will help you gauge the probability of an effective reversal.
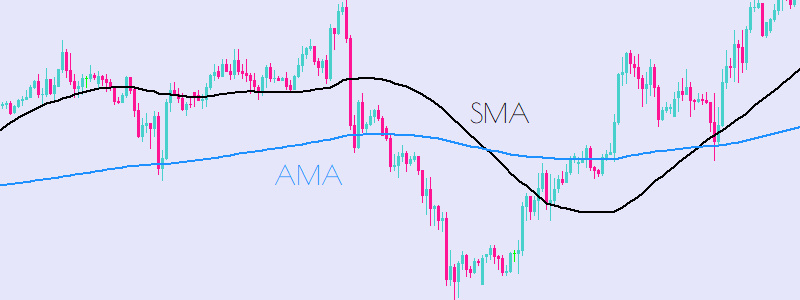
What is the Adaptive Moving Average (AMA)
To solve one of the largest problems with moving averages, that is the high proportion of signal to noise, the adaptive moving average (AMA) multiplies the weighting factor of the MA by the volatility ratio,
This thus means that the moving average would be further from the current price in volatile markets, like those seen in 2020, and thus winning positions can be extended. As the price starts to consolidate and the moving average comes closer to current price, due to decreased volatility, the trader should be able to capture most of the gains from the trade.
The volatility ratio is often calculated as the distance between Bollinger Bands, in times of high volatility the bands expand to encompass the larger price movements and in times of low volatility they undergo the so called, Bollinger Band Squeeze.
The Adaptive Moving average has also been extended by Kaufman in replacing the weighting variable in the AMA with the efficiency ratio, which can be used to gauge the strength of trends on a scale of -1.0 – 1.0.
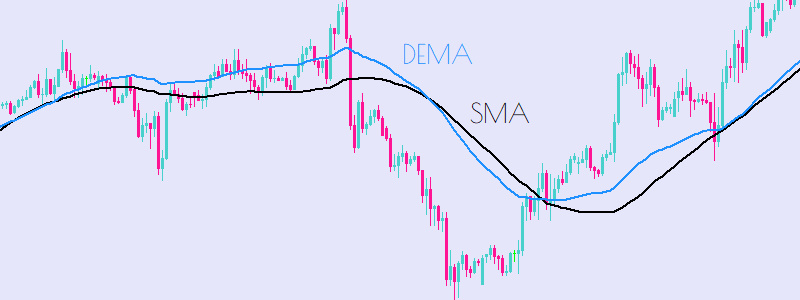
What is the Double Exponential Moving Average (DEMA)
The Double Exponential Moving Average was introduced by Patrick Mulloy in 1994 in the Technical Analysis of Stock & Commodities magazine.
The DEMA uses two exponential moving averages in an attempt to eliminate lag, otherwise the DEMA works in the same was as normal moving averages with trend gauging and pivot point analysis.
The DEMA responds far faster than normal EMA’s thus making it suitable for more aggressive traders, however the lower amount of lag also increases the amount of noise that the reader may perceive to be a signal.
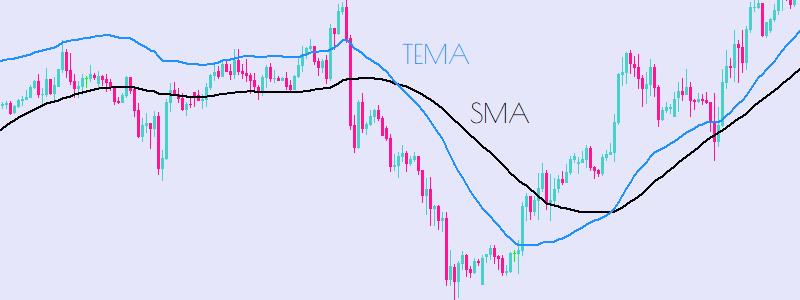
What is the Triple Exponential Moving Average (TEMA)
The Triple Exponential (TEMA) is a modification to the double exponential moving average where there is one extra exponential moving average applied to the price.
The result is just an extension of the double exponential where, the sensitivity of the moving average is higher (lower lag) but with the increased amount of noise. Heavy filtering or large periods are recommended when using the TEMA (Triple Exponential Moving Average).
What is the Triangular Moving Average (TMA)
The triangular moving average is a double smoothed MA that uses a weighted moving average that places specific weight on the prices in the middle of the period, hence the triangular nature of the moving average.
The moving average does not react as fast as the SMA does however this can be an advantage for longer term traders who look for higher quality signals to match their lower entry opportunities.
The TMA is also very effective at detecting ranging markets, unlike the EMA and its variants, as the TMA will not respond much to the price changes and thus preventing the trader from being trapped within the ranges.
However this does mean that if the trend were to turn against your position you would be exiting it later and thus giving up some more profits, traders should use multiple time frames to gauge entry and exit.
Usefulness of shifting Moving Averages
Shifting a moving average simply moved the value of the MA in time. A Moving Average shift of 1 will cause the MA value of bar 0 to be the same as bar 1. In effect the moving average is now lagged by a period of 1. You can also shift the moving average forward by setting the shifting period to be negative. Be wary however as negative shifts look excellent on the chart but the latest value is still with a lag inherent in its calculation.
Price forms used to calculate Moving Averages
Moving averages can be calculated using various combinations of price forms which are listed below. Details and illustrations for each price form are also covered throughout this guide.
- Close Price
- Open Price
- Low Price
- High Price
- Median Price
- Typical Price
- Weighted Price
What is Close Price?
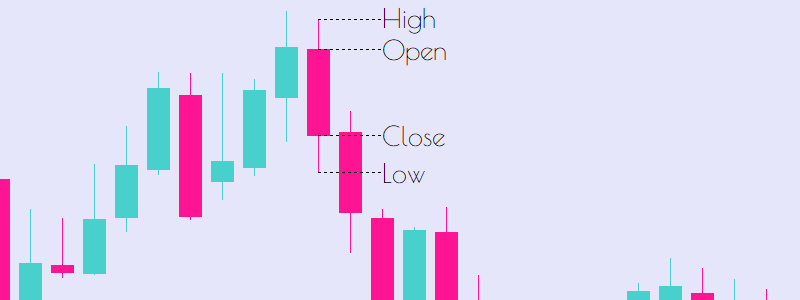
The close price is the final price of the candle period. The close price is represented as the top of the green candle body if bullish or bottom of the red candle body if bearish. See the OHLC illustration below for more details.
What is Open Price?
The open price is the first price of the candle period. The open price is represented as the bottom of the green candle body if bullish or top of the red candle body if bearish. See the OHLC illustration below for more details.
What is Low Price?
The low price is the lowest price reached within the candle period. The low price is represented as the bottom of the both bullish and bearish candle wicks (not body). See the OHLC illustration below for more details.
What is High Price?
The high price is the highest price reached within the candle period. The high price is represented as the top of the both bullish and bearish candle wicks (not body). See the OHLC illustration below for more details.
What is OHLC?
OHLC stands for open, high, low, close and is a common term used amongst traders and technical analysts to encompass all 4 main price forms within the candle period. See the OHLC illustration below for more details.
- O = Open price within the candle period
- H = High price within the candle period
- L = Low price within the candle period
- C = Close price within the candle period
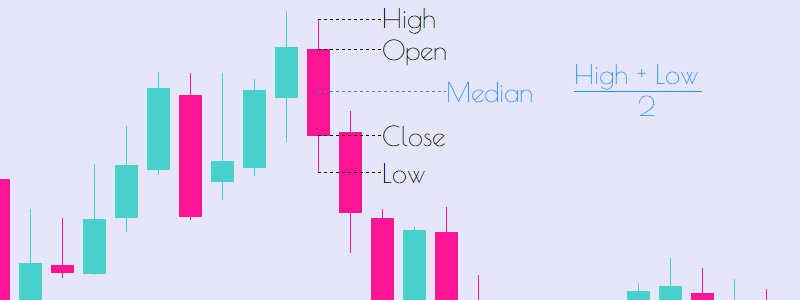
What is Median Price?
The median price is the quotient of the sum of highest price and lowest price within the candle period by 2. See the median price formula and illustration below for more details.
- Median Price Formula
- Median Price = (High + Low) / 2
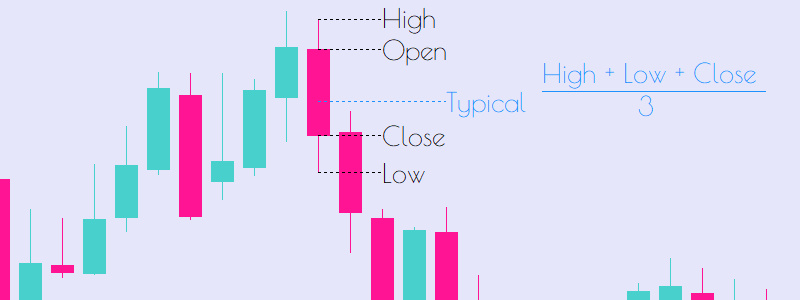
What is Typical Price?
The typical price is the quotient of the sum of highest price, lowest price and closing price within the candle period by 3. See the typical price formula and illustration below for more details.
- Typical Price Formula
- Typical Price = (High + Low + Close) / 3
What is Weighted Price?
The weighted price is the quotient of the sum of highest price, lowest price and closing price twice within the candle period by 4. See the weighted price formula and illustration below for more details.
- Weighted Price Formula
- Weighted Price = (High + Low + Close + Close) / 4

Remarks on Price Forms in Moving Averages
All these Various price types can be used when calculating moving averages however choosing between which metric to use can often make or break strategies.
Whereas the Close price is the most often used, it can be misleading as remember when you are within the market trading, you do not know the close price until the very last moment and so when you actually go to enter into the position the bar has already closed and you may be susceptible to gaps between bars, which for scalping strategies can be fatal.
The median price represents a good balance between encompassing data and also being viable in real time use, however in very volatile markets and shorter time frames the median price can also be skewed by extreme moves in one direction. The wicks are often just seen as noise and so traders should take note of this.
The open price is recommended to aggressive traders who enter positions very quickly looking to scalp, the weighted price is recommended to longer term traders who do not need such sniper entries.
Links for the TMA Indicator
Visit the Triangular Moving Average Indicator Subscription Page
User Guide & Docs for the Triangular Moving Average Indicator
Article Link for the Reversals Trading Strategy
Medium Link for this Moving Average Guide Article
MetaTrader Trading Indicators & EAs
For indicators and EAs other than our TMA indicator, check out the links below:
Trend Bias Indicator
Dual Grid Expert Advisor
Trend Divergence Indicator
Volume Insight & Divergence Indicator
Dynamic Trend Duo Expert Advisor
All alphaeim EAs, Indicators & Dashboards
alphaheim Trading Tools for MetaTrader